Setup


RhB@PLB Solution. We fabricate colloidal solutions by incorporating fluorescent dyes into polystyrene latex beads, in order to measure the level of saturation as a function of fluorescence intensity. Prior to the addition of rhodamine B (Acros Organics), a 0.1 M sodium bicarbonate buffer at pH 9.4 is prepared to ensure proper color concentration of the dye. The buffer is made with 30 ml of 0.1 M sodium carbonate and 70 ml of 0.1 M sodium bicarbonate and is diluted to 0.2 mM. Then, rhodamine B is added to the buffer solution to make a 0.1 mM fluorescence solution. The rhodamine B solutions are refined before use with a syringe filter (0.2 μm pore size). After this, monodisperse sulfate latex beads with an 8% concentration (Thermofisher Scientific, Life Technologies Corporation) and particles with 300 nm diameter are dispersed in diluted water via sonication for 20 minutes. Finally, the colloidal solution is diluted from 8% to 4% by adding rhodamine B solutions to create the RhB@PLB solution.
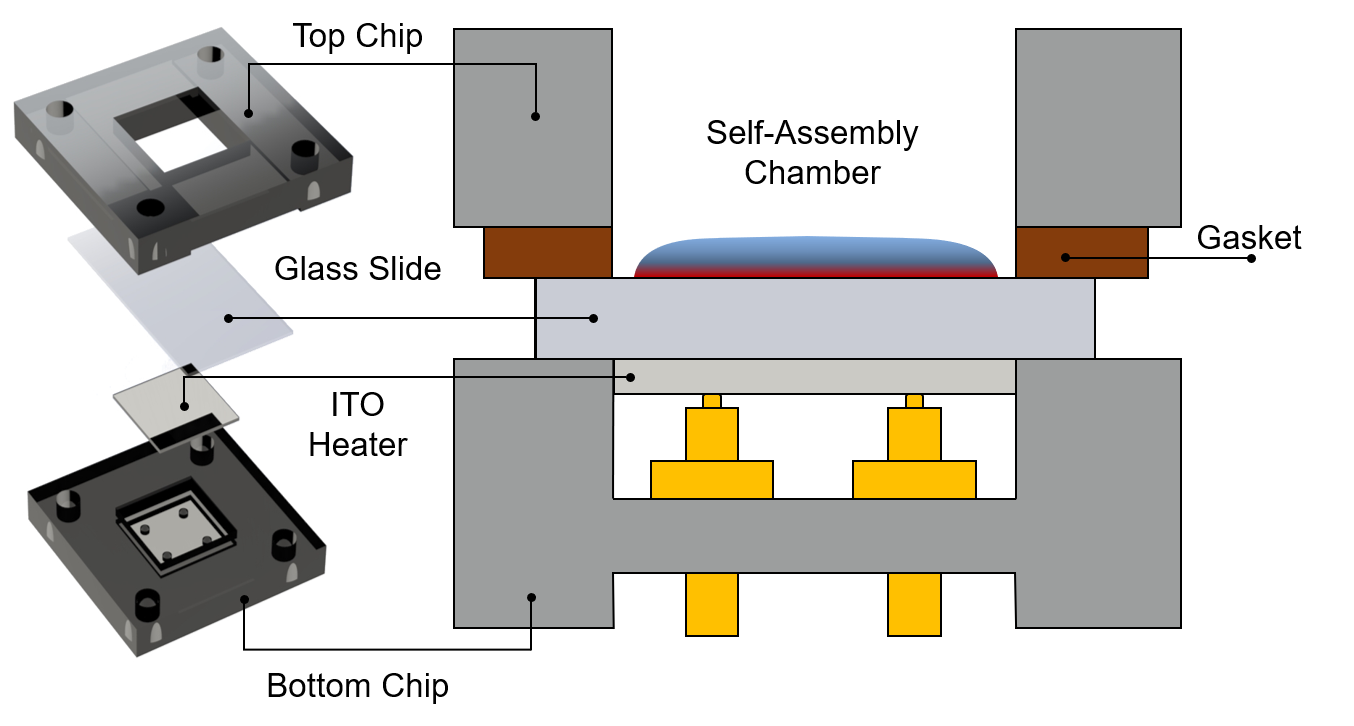
Custom Self-Assembly Chip. We design a customized chip to visualize the colloidal self-assembly by using an upright microscope. The chip consists of top and bottom acrylic platforms, a removable glass slide, a rubber gasket, spring-loaded pogo pins, and a transparent ITO heater. The top and bottom substrates are machined using computer numerical control (CNC) machine to ensure the liquid feeding without leakage.
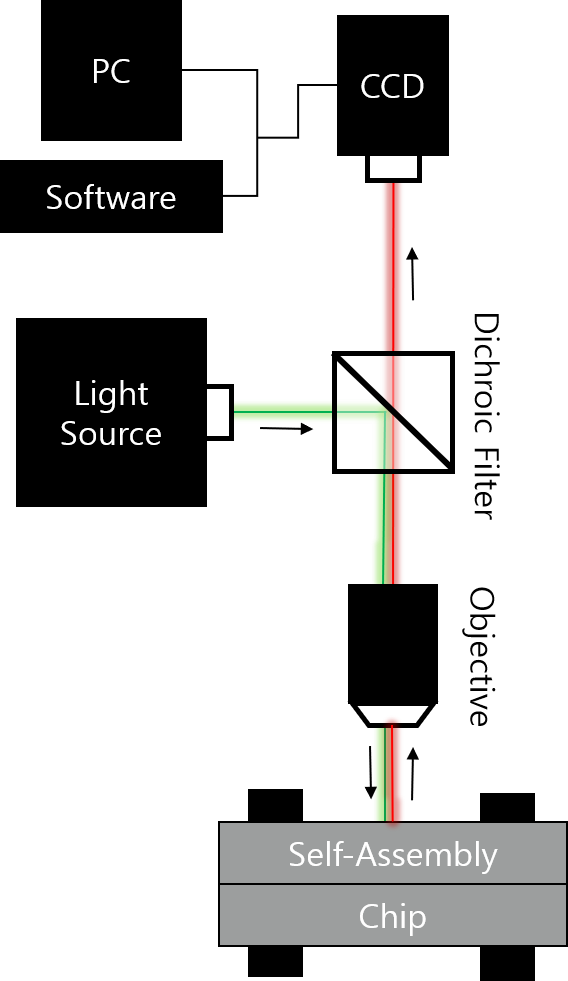
Image Acquisition. Fluorescence imaging of the rhodamine dye is performed using an upright confocal fluorescence microscope (BX61, Olympus) with a 10 mm long working distance objective. The upright microscope enables top to bottom surface imaging and thus is suitable for surface analysis. An appropriate filter set (excitation: band pass 559 nm, emission: band pass 570-800 nm) and a broadband mercury illumination are used. For saturation level measurements, a low lasing intensity of 0.3% (to reduce photobleaching of the fluorophore) excites the fluid at wavelengths of 559 nm to fluoresce while the fluorimeter records the fluorescence spectra. The high voltage (HV) and gain are set manually and are kept constant throughout a given set of experiments. Digital images are obtained and post-processed through FluoView FV1000 software. Image colors are added using built-in channel options.


